Leaderboard


Popular Content
Showing content with the highest reputation on 06/25/2019 in all areas
-
2 points4 breaks at work this weekend we did some flinging.
-
1 pointFOR SALE: ZEISS Conquest 3.5-10x44 MC Rifle Scope Rapid Z- 600 Reticle; 1" Tube Scope is mint, I will throw in the rings as well (Talley Lightweight Rings) $550 Tucson
-
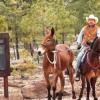
1 point4 days of riding and camping in the cool empty pines. A little lonely but mom came by to visit and I brought plenty of books. Pretty cool I took mom for her first ever mule ride and only her second time on horseback in 40 years. We came upon a coyote which we followed from way back and she led us to her den full of pups, so cool to have mom see that. Came across two separate bands of "wild horses" and snagged some good video. There are horses in some of these pics but phone doesn't make it good to see them It's super dry up there but the tanks have good water. It's just dry everywhere else. Be careful with flames and heat. I chose no fire for the week but I could have legally had one.
-
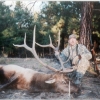
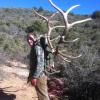
1 pointTook the kid and her boyfriend out shed hunting today, She found the small elk shed in the 1st 10 mins then the old muley she 10 mins later. 1st time we went out specifically looking for sheds and she finds some. Last time we were on a turkey shed hunt trip and she found that deadhead.
-
1 pointBull in my avatar is from 4A.
-
1 pointI have a hard time remembering its a wildfire. All I can think of every afternoon when the smoke settles up here in the White Mountains that all of southern Az must be using mesquite for their BBQ. It is always tough to see fire burn through some of our favorite areas but it will rebound and do great very quickly.
-
1 pointi've got that archery 4a bull tag too. excited!
-
1 pointTurtle humped 24 pit chickens
-
1 pointThe link below displays an interactive map (I am developer) showing the latest perimeter for the Woodbury fire. Each time you open the map it also shows the latest satellite hotspot data. This project is a public service and part of my way to “pay it forward”. None of this data is ‘real time’. Never rely on any map to ignore an order to evacuate! The fire perimeter (red and black line) is determined as a result of an overnight flight by a plane equipped with infrared sensing gear. That data is then analyzed by fire staff in the wee hours and the resulting data is hosted on the NIFC FTP site for anyone to use. When there is a big fire (like this one) I get up early and make sure my map is displaying the most recent perimeter. Eventually this same perimeter data shows up on the Inciweb map but for reasons unknown (at least to me) it often takes hours for that to happen. OK - I just checked. The perimeter shown on the Inciweb *interactive* map is from June 20. Not helpful! There are two MODIS satellites (red triangle) and one VIIRS satellite (orange square). Together they make 4-6 passes per 24 hours. By the time you see satellite data on any map it is already 3-9 hours old. The map can display 20+ layers of authoritative data that are hosted on federal GIS (Geographical Information System) servers. For some tips on using the map, please click “Map tips” in the upper left corner. Next to the “Map tips” link there is a “Legend” link. Want to know more about what the satellite hotspot data shows and does not show? You can find that information in the “Map tips”. Want to make your own custom map link? Yup, see the Map tips. When you open the map it is zoomed in a bit on the most active area today. Open GISsurfer map: https://mappingsupport.com/p2/gissurfer.php?center=33.566846,-111.224732&zoom=12&basemap=ESRI_scanned_topo_USA&overlay=VIIRS_24_hours,MODIS_24_hours,GeoMAC_current_perimeters,ESRI_roads_and_labels&txtfile=https://mappingsupport.com/p2/special_maps/disaster/USA_wildland_fire.txt&fire=AZ,Woodbury
-
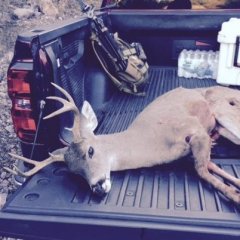
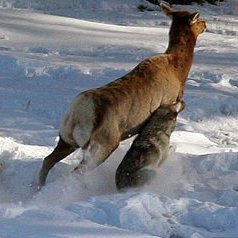
1 pointSomeone has a head start!
-
1 pointFor a few years I had a credit card that I never used so I made it my licenses and tag applications card. That way I never have to worry about what my account balance is in the event I draw a tag. It never comes out of the safe except for application time.
-
1 pointHow long do you need it to stick?
-
1 pointStarted at the Badger Springs trailhead. Just like the Woodbury fire started at the Woodbury trailhead. Makes you wonder. Either there are a bunch of stupid hikers....or...........
-
1 pointWhy wouldn’t you post the pictures of the crime? As far as we can tell, someone has a vendetta against an old man trying to walk his dogs
-
1 pointOff work early on a Friday sitting in your underwear drunk in front of your computer?
-
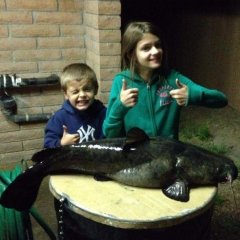
1 pointnice dude. did you catch a bluefin?
-
1 pointJust wanted to reach out and say that if any houndsmen need a place to keep their dogs I have plenty of room with SOME spare houses if you need to evac and dont know what to do. No house but you can set up a camper right there and have your dogs there and be safe till things pass. No just an offer for the Woodbury fire but any that happen. I have a small puppy pen already set up but just wanted to throw it out there if anyone needs a place. Property is big enough for horses or mules too but there is no fencing so that may hinder that unless you bring panels. Send me a message if you need a place for you and your dogs.
-
1 pointI would if I could Listen and you can hear the whales.
-
1 pointYou old granola eater you. Idk how you pull those horses with a suburu
-
1 pointIf you are a hipster with money to burn just go with Kuiu. Otherwise just hunt.
-
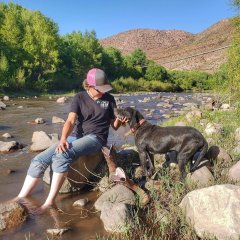
1 pointWe used to hunt Geese there many years ago. Deer were all over then and driving those roads was always a white knuckler. Deer were all over the place. I wonder how it is nowadays? That is one beautiful area and the fishing can be really good too.
-
1 pointJoin us on June 22nd as we install 13 signs in and around the Sonoran Desert National Monument and North Maricopa Mountains Wilderness. This area has seen a lot of abuse over the years and our signage project is an attempt to help mitigate illegal off road use and damage to the habitat. Contact arizona@backcountyhunters.org for more info.
-
1 pointFOR SALE: Leupold VX-R 4-12x40 CDS Fire Dot Reticle 30mm Tube Excellent Shape, Scope only no rings/scope covers. I have the original top turret cap. $500 Tucson
-
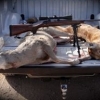
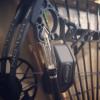
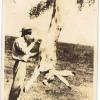
1 pointHere's the bow to go with the arrows, at full draw it feels more like 60lbs, I'm guessing my draw is longer than planned for this build its 65 X 50lbs and very cool that its ambidextrous, shot it from both sides.
-
1 pointVery good condition 10/22 takedown with tactical stock and like new wood stock (took it off when I got the rifle and never used it). It is the 50th anniversary version. Includes 3 of the 10 round mags and 1 of the 25 round mag, all Ruger. Comes with an aftermarket scope rail, and I believe I can find the factory rail. Comes with the factory bag, and I might have the paperwork and lock for it as well, but I moved some stuff and am still looking for it. Over $500 bucks into this thing, looking to sell for $350. East Valley. Will post pics up later.